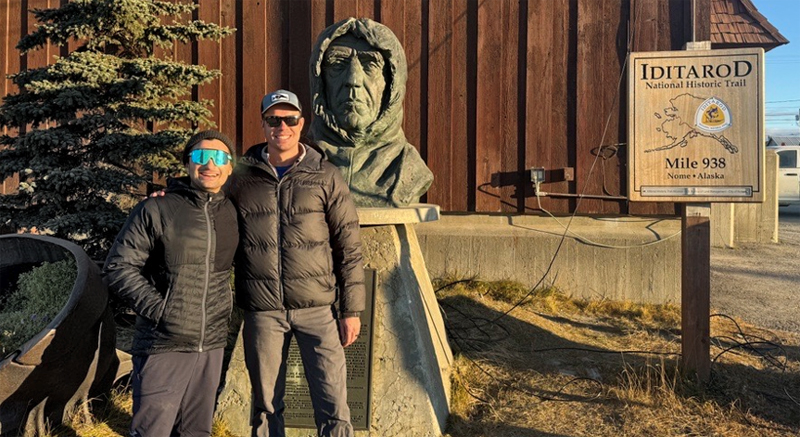
Kaan Cav and Andrew Niedbala are currently aboard USCGC Healy as part of the scientific party to support mapping efforts of the United States exclusive economic zone north of Alaska and to support the Arctic Port Access Route Study (PARS) which helps inform policy makers and regulators regarding vessel traffic in the Arctic.
Andrew and Kaan are both UNH graduate students studying at the Center for Coastal and Ocean Mapping. Kaan is an outdoor enthusiast who has a background in physics. He particularly appreciates the convergence of physical science and nature t
hat comes with ocean mapping. Andrew is a lieutenant in the US Coast Guard and was particularly excited for the unique opportunity to map aboard the Healy as both a mapper and Coast Guard member.
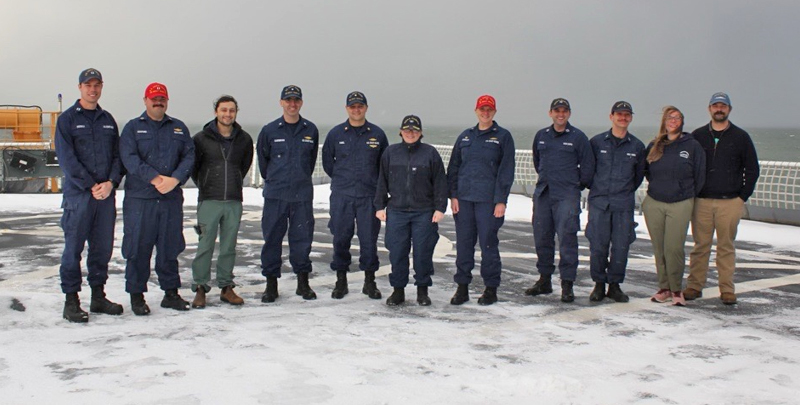
The science party includes a NOAA mapping team, STARC (Ship-based Technical Support in the Arctic), a Community Observer, and the two hydrographers from UNH among others.
Learn more about Healy's 2024 Arctic Deployment >>
October 10–15
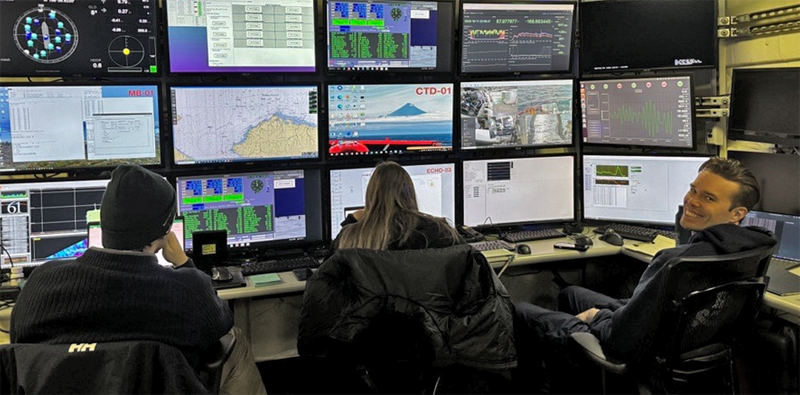
We boarded Healy in Nome, Alaska and began to head north! Onboard, the first item on the entire science party’s agenda was a shipboard orientation, safety training, and an abandon ship drill. After this and getting settled into our rooms, the science team got to work to get all the equipment ready. The ship has an installed deepwater mapping system (EM122) and subbottom profiler (Knudsen CHIRP 3260) which the NOAA team quickly got to work preparing for the business of mapping. These are not the only systems however. The STARC team onboard oversees all installed scientific equipment which also includes a vast array of meteorological sensors, oceanographic sensors such as a rosette CTD, an acoustic doppler current profiler, many lab spaces, and the data acquisition pipeline.
Once the mapping systems were up and running, and the ship was steaming north, the data collection began in earnest. Much of the early data collected was in the shallow shelf waters of the Northern Berring Sea and Chukchi Sea. Mapping shallow waters with a deepwater system is not ideal, however the NOAA and UNH team worked together to fine tune the mapping system’s settings for the best data resolution and quality, ensuring quality bathymetry data for Arctic mariners.

After the few days of shallow mapping during the transit north, the Healy finally steamed over the continental slope and we watched the ocean floor slowly drop out from beneath us on the display. It’s an earie sensation to know the ocean is getting deeper even when you look out the window and the ocean looks the same….
October 16
We have been continuing to map the exclusive economic zone of the northeastern most portion of Alaska. In addition to the multibeam echosounder data which takes a swath of soundings for bathymetric coverage, we are also running a subbottom profiler. The purpose of the subbottom profiler is not to gather bathymetry data, but rather to glean information about the upper layers of the Earth’s crust. This is invaluable information to geologists who are interested in the formation and characteristics of the ocean floor. In our case, for researchers studying the abyssal plain of the Arctic Ocean. While geologists are very interested in this data, it can also be used to investigate a nation’s extended continental shelf. For more information please visit CCOM's Law of the Sea page.
Acquiring the first high resolution bottom coverage of the ocean floor can be exciting; you are not sure what you will find! On charts in locations where only a limited amount of modern mapping has taken place, cartographers may be forced to use soundings from very old single beam or even lead line surveys. We can investigate these in advance and hope to predict what we may see. One sounding still on the modern charts we are using is suspiciously shallow, about a third of the depth of the surrounding area. We tracked its origin down to an early 1900’s chart archived in NOAA’s Historical Map and Chart Collection database. This is the earliest record of the sounding, and it was likely taken from an even earlier survey, possibly in the 1800s.

This sounding in particular must have been a lead line sounding, presumably measured and fixed from surveyors traversing ice (or possibly in open ocean by boat…this would be extremely impressive). While the accuracy of old soundings like these can be impressive, they can also be suspect. Fortunately we are able to place one of our track-lines over this sounding and our multibeam echosounder will be able to tell us the actual shape of the ocean floor here. Could it be a seamount?
October 17–18
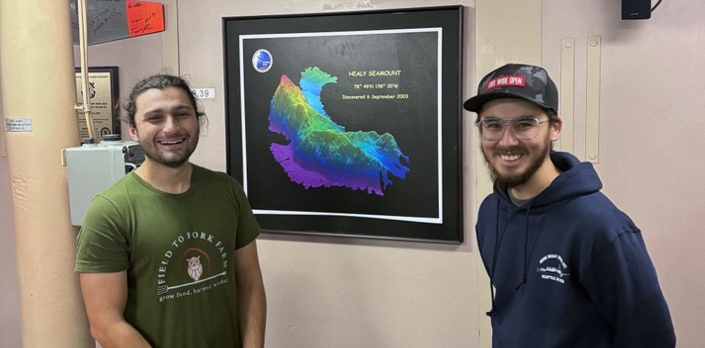
Unfortunately, the suspect sounding proved to be an errant sounding rather than a seamount. However, it is suspected there are more than 100,000 seamounts in the world’s oceans, with fewer than 10% of them being explored. Back in 2012, mappers and scientists from CCOM/JHC aboard this same vessel discovered a previously unknown seamount which was later named the Healy Seamount. You can read more about it in that cruise’s research log at HEALY 1202 Research Cruise | The Center for Coastal and Ocean Mapping (unh.edu).

We do continue to collect high quality bathymetry within the US’s exclusive economic zone and the PARS. While mapping, water column sound speed measurements are critical to accurate data. Though unable to take full CTD casts, we are able to use expendable bathythermographs (XBT). XBTs only measure temperature, but they are able to taking water column measurements while not interrupting the vessel’s progress. An estimated sound speed profile is then extracted from these measurements for use interpreting the multibeam echosounder’s measurements.
October 19–20
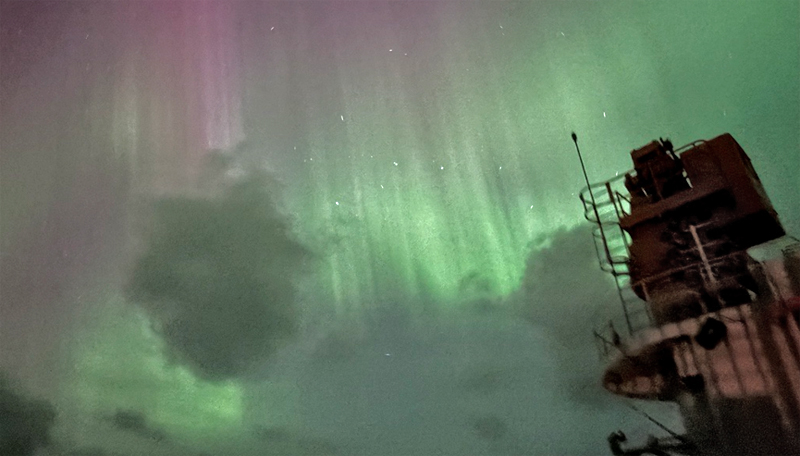
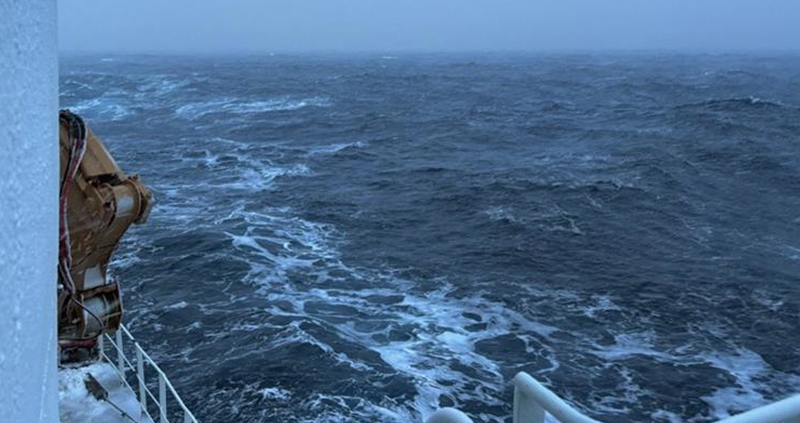
While the daily life inside the vessel now feels familiar, the weather is as fickle as you can have at sea. From 200m visibility in a blizzard to calm and a full horizon mere minutes later. Unfortunately, we have not been lucky enough to have many clear nights; we are hoping the next few to come will show the stars and possibly some more northern lights.
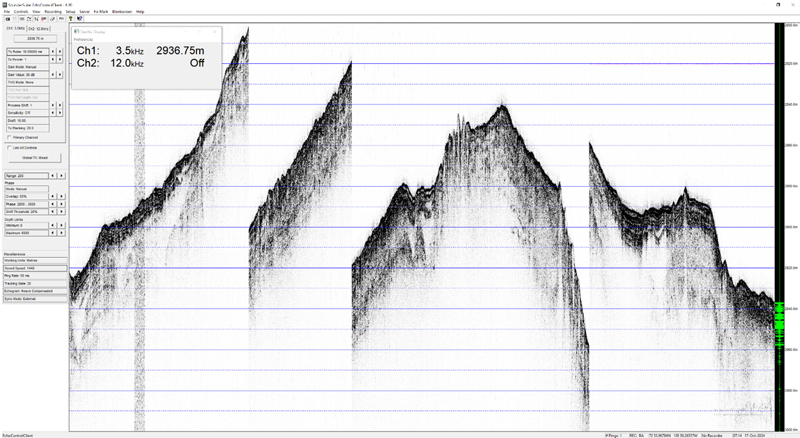
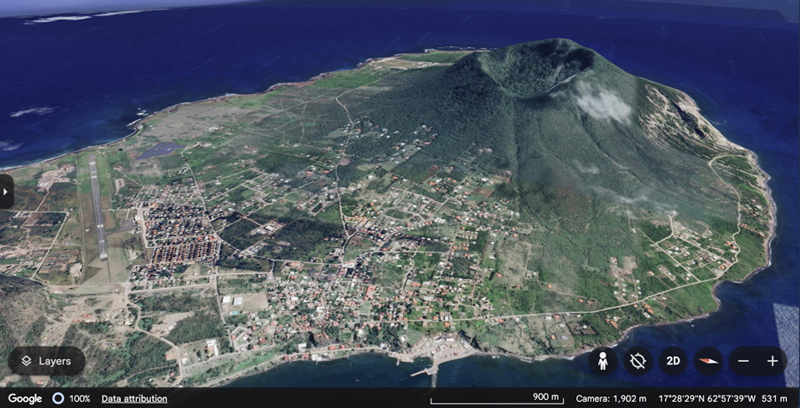
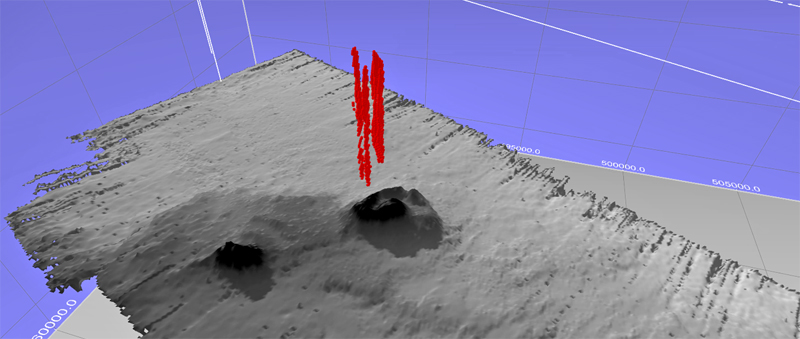
Despite seeing largely flat seafloor, we were surprised to see a significant change of elevation at the multibeam acquisition station the morning of the 20th! One of the NOAA members, Lieutenant Taylor Krabiel, was quick to process it and reveal that it was actually a rather interesting bottom feature. We quickly turned Healy around for another two passes to make sure we mapped it adequately. We were pleasantly surprised when data processing revealed that it is in fact two bottom features! They are 400-500m in relief, and their peaks are about 3,000m apart.

The features are rather interesting, and several theories have been lightly discussed: from mud volcanos and pingos, to a traditional volcanos. Regardless of their geological origin, they almost certainly of interest to future researchers. The size and shape of the larger of the two is particularly similar to The Quill on Sint Eustatius, which is also about 500m above the town below.

October 21–22
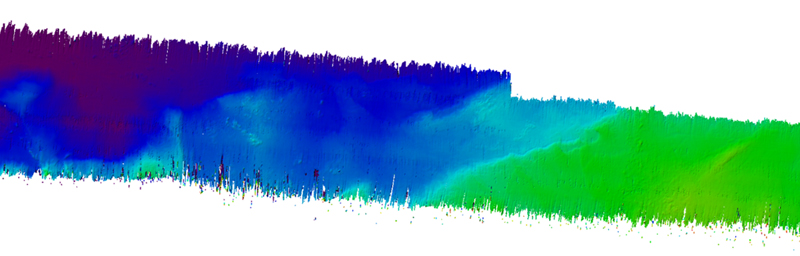
After the discovery of the unique bottom feature, we have been looking through all the data that we have collected in an attempt to learn more. During two of our passes, we didn’t just record the bottom soundings from the multibeam echosounder, we also recorded the water column returns. When we viewed the water column files, we were able to identify significant vertical returns over the larger of the two features during both passes. These vertical returns existed over the larger of the two features, and not over the smaller feature nor any other part of the ship’s track.
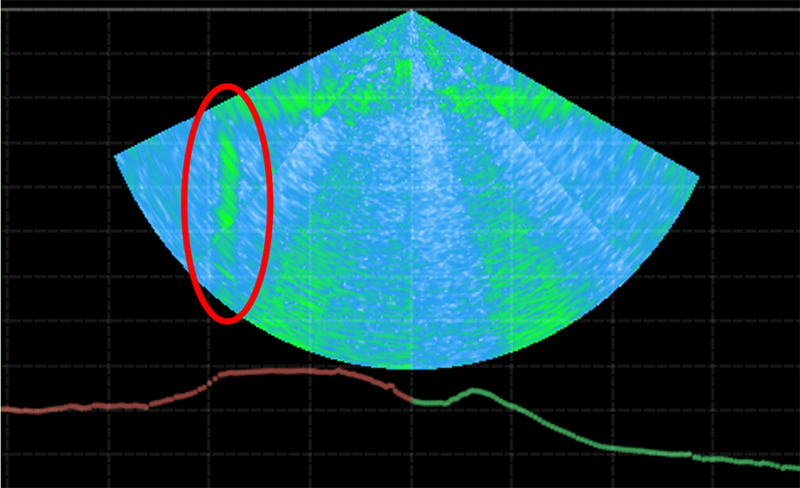
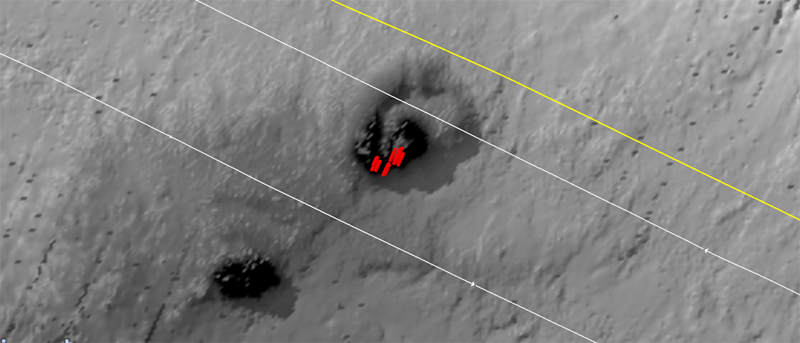
Using post processing software, we filtered the water column data by intensity and converted significant returns into a 3D point cloud. The resulting point cloud suggests there is a seep (likely some form of gas) from the feature entering the water column and rising upward.
One of the important parts of this analysis is that we are not selecting opportune returns to construct an image that we want. Each of the points represents an acoustic return above a minimum threshold and is able to be spatially referenced. Below is a plan view of the point clouds which show their location over the feature.
This is very exciting to see, and we wish we had either the time or equipment onboard to properly explore the feature. Hopefully future cruises from the Healy or other research vessels will be able to explore the feature in detail.
October 23
We are fortunate to have a community observer representing native Alaskans on this cruise. Thriving indigenous populations live across the Arctic. As scientists in the Arctic, it is important to learn about their culture and learn from their generational knowledge. Lloyd Pikok is a subsistence hunter, photographer, local guide, organizer, and leader. Through daily conversations as well as presentations, we are able to learn more about the interaction between science and community in this harsh environment.

Unfortunately, we are not going to see any ice on this part of Healy’s patrol. It feels strange to spend two weeks in the Arctic Ocean without seeing even newly forming sea ice. Lloyd, when asked a question regarding changes in his lifetime during a presentation, said that he has personally noticed seasons shifting in the Arctic as he has grown older. All of this does make us wonder, what will this region look like in just a few decades?
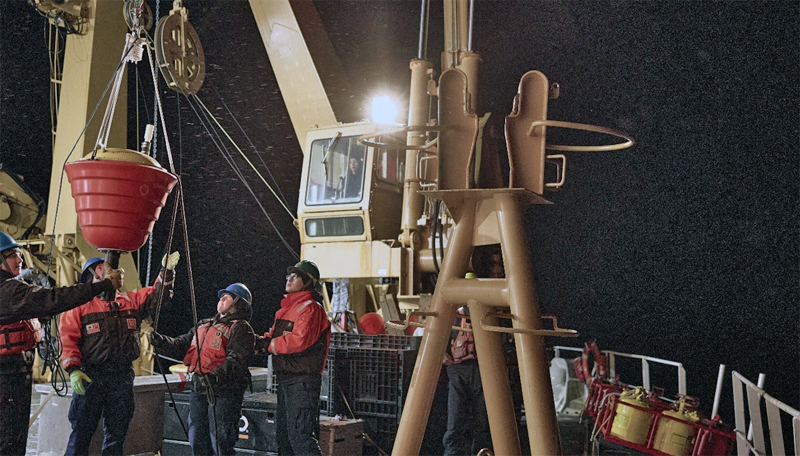
Healy has not been only mapping. It is a very capable platform which can accommodate and perform a wide range of scientific research. During this leg of the cruise, scientific data buoys have been deployed over the stern of the ship to take surface measurements across the Arctic Ocean. The science on every cruise is different, and it is interesting to see the other research objectives that we are not directly tied to.
October 24
It is our last full day onboard Healy. It has flown by, and we cannot believe it is already over. We steamed south through the Bering strait overnight, and for the first time in a while we can see distant mountains letting us know that we are not too far away from land.

Much of today was taken up by data processing and data storage (its amazing how long transferring hundreds of gigabytes of raw data takes). We also took time to spend time with the crew members and new friends that we made during our voyage; this included participating in trivia night on the messdeck.
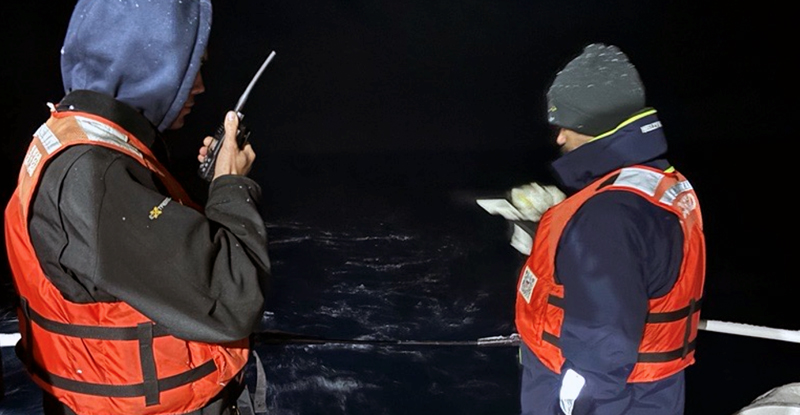
While waiting outside of Nome in the evening, we were fortunate that the comet Tsuchinshan-ATLAS was still just barely visible. Nearly the entire time thus far has been too cloudy to view. Tonight was clear and we could just make it out by naked eye and a little better through binoculars; however, night vision goggles provided the best view by far.

October 25–26
We depart Healy after two weeks of mapping. In total, we mapped over 4,000 sq. miles of the seafloor and filled coverage gaps in the PARS corridor.
After completing the mapping certificate portion of our degrees, this was an amazing opportunity to use our skills to benefit the American people, and we impressed ourselves with how much we learned and how comfortable the mapping was to us. CCOM truly prepared us well and we’re happy to have added this real experience to our education as we finish the masters portion of our degrees. Sailing aboard Healy was a once in a lifetime opportunity which we both hope is not only once in a lifetime.