JHC/CCOM Participant: Christos Kastrisios
Other Collaborators: Noel Dyer (NOAA MCD), Leila De Floriani (University of Maryland)
Contemporary bathymetric data collection systems collect data at sub-meter resolution to support nautical charting for safe navigation as well as other scientific uses and applications. For nautical charting, these high-resolution datasets must be generalized for compatibility with field practices and specifications. Algorithms that can provide consistent results while reducing production time and costs are increasingly valuable; particularly in nautical cartography, updates to bathymetry and locations of dangers to navigation need to be disseminated as quickly as possible. The process of generalizing source bathymetry data is known as sounding selection and can be separated into hydrographic and cartographic. Hydrographic sounding selection involves generalizing bathymetric datasets to produce a shoal-biased and dense, yet manageable, subset of soundings that can support the subsequent cartographic selection. Traditionally, hydrographic sounding selection was in the form of a sheet of paper, known as a smooth-sheet. The smooth-sheet was a manual shoal-bias selection from the source data, where the physical dimensions of the paper and label sizes limited the quantity of soundings that could be included.
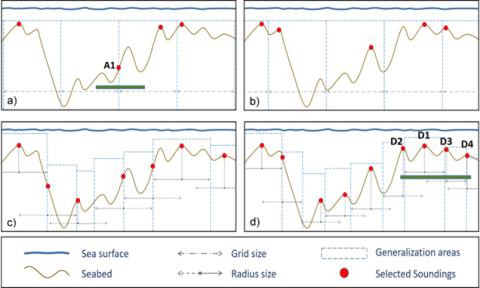
Figure 31-1. Vertical profile of seabed and the selection with grid- (A, B) and radius-based (C, D) generalization approaches using different grid point of origin (A–B) and radius size (C–D).
With digital cartographic production systems, hydrographic sounding selections are stored in a digital format, namely point clouds. Currently, automated algorithms for hydrographic soundings selection rely on radius- and grid-based approaches, but their outputs normally contain a dense set of soundings with a significant number of cartographic constraint violations, thus increasing the burden and cost of the subsequent, mostly manual, cartographic sounding selection. Existing algorithms rely on simple distance metrics, but are intrinsically limited in that they do not consider portrayal of soundings on ECDIS screens. Also, they require user-defined input parameters, which can significantly affect the results depending on the selected values. As Figure 31-1 illustrates, the use of different points of origin for the grid-based approach (Figures 31-1(A) and 31-1(B)), as well as different radius/grid sizes (Figures 31-1(C) and 31-1(D) for radius-based) results in different selections.
Christos Kastrisios, Noel Dyer from NOAA MCD, and Leila de Floriani from the University of Maryland at College Park have been working on the development of a comprehensive sounding selection algorithm for use in nautical charting. The effort is divided into Hydrographic (presented here) and Cartographic sounding selections (discussed in Task 33, Project: Cartographic Sounding Selection).
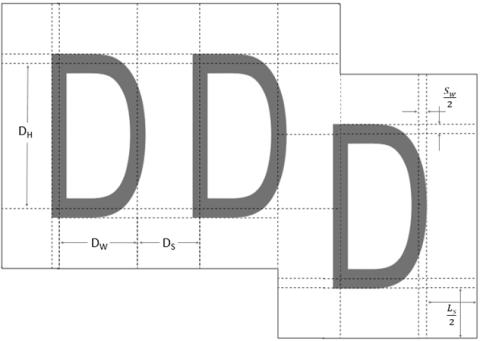
Figure 31-2. The general case of the polygon label footprint with the label spacing.
For Hydrographic Selection, the research team focused on the generalization of the source, high-resolution point cloud to a shoal-biased subset that contains the maximum density of soundings that could be portrayed at the scale of the product. To achieve this, the research team proposed a label-based generalization approach that accounts for the physical dimensions of the symbolized soundings. The calculation of the label footprint requires the glyph (D in Figure 31-2) height (DH), glyph width (DW), stroke width (SW), spacing between glyphs (DS), and label spacing (LS) (Figure 31-2). A minimum label spacing must be maintained to ensure legibility and avoid confusion between two neighboring labels that can be interpreted as a single label, e.g., a 23 m or 2.3 m label from individual labels of 2 m and 3 m. The complex polygon of Figure 31-2 is the result of the vertical offset for the decimal value (required by S-52 standards), a long-lasting practice in nautical cartography bequeathed to ENCs from paper charts. As a result, the depth label footprint can be polygonal or rectangular in shape depending on whether it contains a decimal or not. Furthermore, in general mapping practices, labels are rendered directly on top of an elevation or depth measurement, where the measurement is the centroid of the label bounding box. However, in nautical cartography, label placement is much more complicated, being determined by the number of glyphs and presence of decimal values composing the sounding label (IHO, 2017a). This illustrates the complexity of the problem, which cannot be approximated with a single value parameter for use with the radius or grid-based approaches and exemplifies the need for a label-based generalization approach.
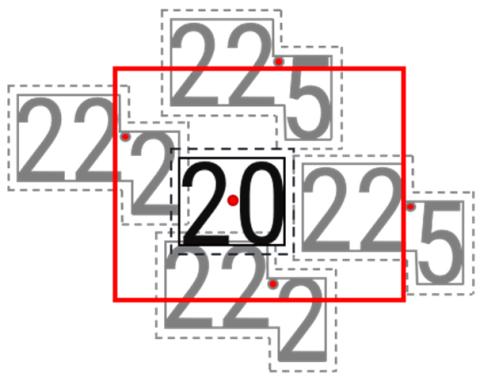
Figure 31-3. Example generalization footprints for the first (black) and second (red) components of the label-based generalization process.
The first component of the label-based generalization consists of removing deep soundings directly inside the sounding label footprint of Figure 31-2 (left) to enforce shoal-bias, while the second component removes soundings whose labels overlap with shallower sounding labels. This is achieved by using a legibility rectangle (in red in Figure 31-2 -right) calculated specifically for the label footprint of the target sounding (in black in Figure 31-3), labels of potential neighbors (in grey in Figure 31-2, right), and a label separation value (selected based on human percepFigure 31-3. Over- and/or under- generalization as a result of the radius-based generalization approaches, where the radius length, R, is based on the width or height of the sounding label and D represents a given glyph. Figure 31-2. Left: The general case of the polygon label footprint with the label spacing. Right: Example generalization footprints for the first (black) and second (red) components of the label-based generalization process. tion factors) to maintain legibility among soundings. In the example illustrated in Figure 31-2 (right), the 22.2 m soundings are within the legibility rectangle and will be eliminated because, when rendered at scale, they overlap with the 20 m target label. Conversely, the 22.5 m soundings are marginally outside the legibility rectangle, and, as such, are retained in the generalized dataset.
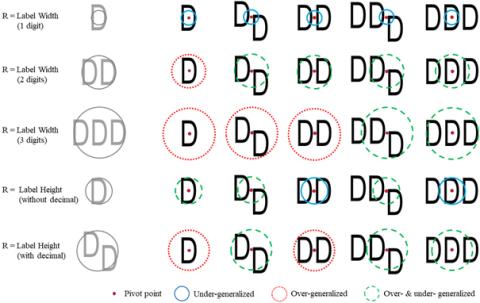
Figure 31-4. Over- and/or under- generalization as a result of the radius-based generalization approaches, where the radius length, R, is based on the width or height of the sounding label and D represents a given glyph.
The examples of Figure 31-1 and Figure 31-4 illustrate the benefits of using the label footprint in the generalization process; current approaches focus on deriving a simplified Digital Landscape Model (DLM) from the source dataset disregarding how ENC features are rendered on ECDIS displays for the generation of the Digital Cartographic Model (DCM). Figures 31-1(A) and 31-1(D) shows soundings that could be potentially selected from either the grid- (A1) or radius-based (D1-D4) approaches. Sounding A1 in Figure 31-1(A) is the shallowest depth for the grid cell, but not the shallowest depth within the x-dimension of the A1 depth label (shown by green bar). A peak is present in the grid cell to the right, which would be contained by the depth label of sounding A1. If sounding A1 became a charted depth through the subsequent cartographic sounding selection process, a deeper depth would be displayed in favor of a shallow depth, resulting in a violation of the functionality constraint and danger to navigation. Similarly, for soundings D1-D4 in Figure 31-1(D), the cartographer would have to manually select one of these soundings for chart display to avoid label overlap and crowding the chart. Selecting the incorrect sounding would be a violation of the safety constraint. However, the proposed label-based approach would automatically select the correct shallow sounding, D1, and eliminate soundings D2-D4, which are deeper and within the D1 depth label. Figure 31-3 illustrates the label footprints for one-, two-, and three-digit soundings, with and without decimals, and how user-defined parameters can result in over- and/ or under-generalizing the dataset.
Table 31-1. Total soundings for each source dataset and the outputs of the four approaches.
| Dataset | . | Source Soundings | Label-Based | Fixed Radius | Variable Radius | Grid-Based | ||||
Charleston Harbor, SC | 221,494 | 1,345 | 8,681 | 6,338 | 4,247 | |||||
Narragansett Bay, RI | 496,433 | 3,212 | 16,677 | 13,017 | 9,275 | |||||
Tampa Bay, FL | 603,132 | 830 | 5,466 | 3,879 | 2,337 | |||||
Strait of Juan de Fuca, WA | 847,461 | 2,946 | 21,367 | 13,524 | 8,465 |
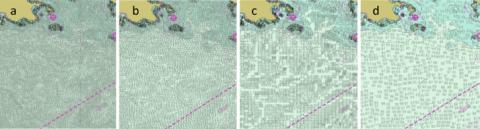
Figure 31-5. Sounding label distributions of generalization approaches for the Strait of Juan de Fuca dataset: a) fixed radius; b) variable radius; c) grid-based; and d) label-based.
Accordingly, the four approaches were evaluated against the four established constraints in nautical cartography, namely, safety (or functionality), legibility, topology, and shape (or morphology). This was the first time in the literature that a sounding selection method has been evaluated against the above four constraints; the approach can serve as a standard metric for future works. The results are summarized in Table 31-2.
Table 31-2. Summary of cartographic constraint violations.
Dataset | Method | Safety | Legibility | Topology | Shape | |||||
| Charleston Harbor, SC | Fixed Radius | 128 | 8,861 | 0 | 0.1764 | |||||
Variable Radius | 122 | 6,338 | 0 | 0.1895 | ||||||
Grid-Based | 90 | 4,247 | 0 | 0.2505 | ||||||
Label-Based | 68 | 0 | 0 | 0.4587 | ||||||
| Narragansett Bay, RI | Fixed Radius | 88 | 16,677 | 0 | 0.1179 | |||||
Variable Radius | 102 | 13,017 | 0 | 0.1305 | ||||||
Grid-Based | 94 | 9,272 | 0 | 0.1610 | ||||||
Label-Based | 80 | 0 | 0 | 0.2885 | ||||||
| Tampa Bay, FL | Fixed Radius | 68 | 5,466 | 0 | 0.2063 | |||||
Variable Radius | 68 | 3,879 | 0 | 0.2309 | ||||||
Grid-Based | 53 | 2,337 | 0 | 0.3015 | ||||||
Label-Based | 19 | 0 | 0 | 0.5169 | ||||||
| Strait of Juan de Fuca, WA | Fixed Radius | 352 | 21,367 | 0 | 0.9546 | |||||
Variable Radius | 342 | 13,524 | 0 | 1.0659 | ||||||
Grid-Based | 167 | 8,465 | 0 | 1.5198 | ||||||
Label-Based | 150 | 0 | 0 | 2.9008 | ||||||
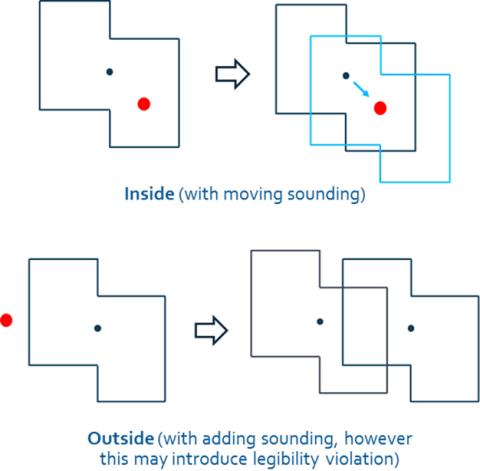
Figure 31-6. The Safety Violations Correction approach.
The proposed label-based approach resulted in the least number of safety violations and zero legibility violations across all datasets. The fact that this is achieved with the least number of soundings makes the introduction of new safety violations in the cartographic process least likely compared to the other approaches due to that the resulting label-based hydrographic selection requires the least amount of generalization for cartography compared to the other approaches. All approaches had no topology (displacement in this case) constraint violations, which is due to the generalized data being derived directly from the source soundings. However, the label-based approach performed least well in adherence to the shape constraint. This is, however, because adherence to the shape of the initial surface as described by the source soundings is directly related to the number of points in the generalized dataset.
The label-based approach had consistently the lowest number of selected soundings among the four algorithms. However, the hydrographic sounding selection from each approach requires further generalization (i.e., the “Cartographic Generalization”), before use in an ENC. This will reduce the number of soundings and, in turn, it is expected to increase the difference in surface roughness before and after generalization. The greater the number of soundings from the hydrographic sounding selection, the greater the degree of generalization that is required for the final cartographic selection, thus, the greater the effect to the surface roughness. The label-based selection will require the least generalization, as it results in the fewest number of soundings. Adherence to the shape constraint after the final, cartographic selection is worth investigating in future work.
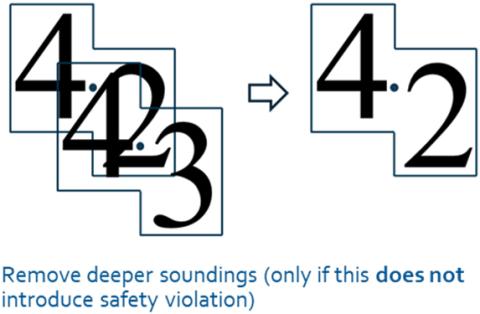
Figure 31-7. The Legibility Violations Correction approach. A deeper sounding is removed only if the action does not introduce a safety violation.
In the 2022 reporting period, the research team worked on making improvements to the proposed algorithm with the aim to derive a set of soundings free of safety violations, as well as making operational a tool with the NOAA/MCD. To eliminate any safety violations, the research team incorporated an iterative process that consists of a Safety Violations Correction and a Legibility Violations Correction phase. For the Safety Violations Correction, the derived dataset is compared to the source information and when a safety violation is detected the algorithm fixes it. The fixing approach depends on whether the violation is within the label footprint (“Inside” violation) or outside of it (“Outside”) as illustrated in Figure 31-6. For the former, the initially selected sounding is moved to / substituted by another sounding within the footprint. For the latter, the violation (flagged sounding) is added to the dataset.
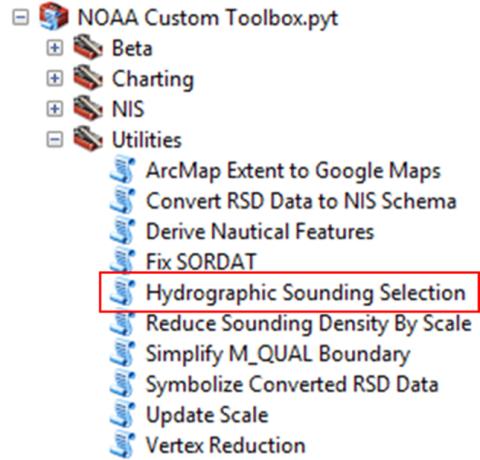
Figure 31-8. The Hydrographic Sounding Selection ArcGIS tool as part of the NOAA MCD production tools.
The additional soundings included in the output introduce legibility violations. The Legibility Violations Correction phase aims to remove legibility violations when this action does not introduce safety violation. That is, a legibility violation is identified, the deeper sounding is selected, and the output without it assessed for safety. If no safety violation is introduced, the deeper sounding is removed (Figure 31-7). The result of the above iterative process is a Hydrographic Sounding Selection free of safety violations but with legibility violations which, however, are expected to be addressed in the subsequent cartographic selection process.
Accordingly, an automated tool was developed and was made available on a git hub repository (https://github.com/NoelDyer/Sounding-Selection) while it was also made available along with the other NOAA MCD production tools for use by MCD cartographers (Figure 31-8).