Project: Industry Discovery
Understanding the day-to-day challenges that ocean mapping professionals are facing can be difficult, since they area many and varied. In this reporting period, Christos Kastrisios participated in the National Science Foundation (NSF) funded Innovation Corps (I-Corps) program organized for UNH by the UNH Innovations, which aims to foster “customer discovery” for researchers. During the experience, participants perform customer interviews to further evaluate the interest of the community on their ideas. Within this context, Kastrisios has focused on the challenges that ocean mapping professionals, including in data collection, processing chart compilation, research and development, production management, and use of products.
In this reporting period Christos Kastrisios contacted a total of 25 professionals from six countries (Brazil, Denmark, France, Greece, Taiwan, and USA) with the majority of them involved in the hydrographic (10 out of the 25) and cartographic (10) aspects of the spectrum. Seventeen of the participants work for national Hydrographic Offices, three for academic institutions (USM, UNH), and five are in the private sector (CARIS, ESRI, QPS, Saildrone).
The initial focus was data collection and processing, expectations/requirements of deliverables, verification, and deficiencies of the process. As expected, the majority of participants (21) identified bathymetry as the prominent data in the field (i.e., survey soundings, charted soundings, depth curves, depth areas), followed by dangers to navigation (DtoN) (8), aids to navigation (AtoN) (3), shorelines (2), and datums (2). (The discussion was open, allowing for multiple concerns to be expressed in each category.)
For deliverables, there is an agreement among participants that they must meet the international and national standards (e.g., S-44, NCM). According to participants’ responses, that essentially means that the delivered dataset must be: shoal-biased (19); continuous and representative of the seafloor (5); free of outliers, consistent, and statistically sound (4); and that all significant dangers to navigation are present (4). When considering verification of deliverables, 16 out the 25 participants perform a manual/visual inspection, three use tools in commercial software, three use in-house or open source tools (HydrOffice QC Tools), and five are using a combination of the commercial and in-house/open source tools.
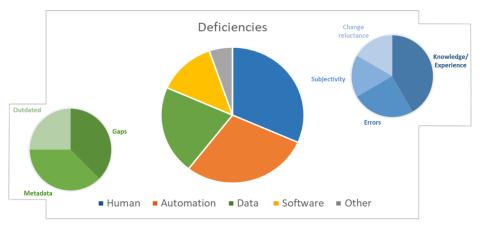
Figure 37-10. The identified deficiencies of the data processing/verification by the participants in the survey.
Lastly, the users were asked to identify the deficiencies in the process. Twelve participants identified human related deficiencies, 11 the absence of automated solutions that could ease the burden of the repetitive and prone-to-error tasks, five software related deficiencies, three data related, and two something else (Figure 37-10). The human-related deficiencies include lack of experience, knowledge, or training (5), errors that a person can make in the process (3), subjectivity and uncertainty in human decisions in the various tasks (2), and resistance to new technologies or ideas (2). Two participants indicated that slow or buggy software was a problem, two that it is “black box” (i.e., the user does not know what is happening in the process), and one that the algorithms are problematic. Data related deficiencies include gaps in the data (3), data are outdated and costly (3), and metadata have errors or not complete (2).
These insights can assist in designing new techniques, and in evaluating research directions for the Center. In the first phase of the project, the research focused on data, processing methods, requirements for the deliverables, verification methods, and deficiencies of the process. The discovery effort will continue in the next reporting period and will attempt to engage with senior professionals and the end-users, i.e., the mariners.
Project: Collaboration with Maritime Training Centers
A map is an abstraction of reality as perceived by the map maker and communicated to the map reader, who, in turn, interprets the geographic space and phenomena based on the inferences made from the mapped features and their interrelations. Being a communication medium, map quality depends on the ability of the transmitter (map maker) and the receiver (map user) to encode and decode the communicated (mapped) information and concepts, and the efficacy of the (cartographic) language in the form of the agreed symbols and conventions. A good map is one that satisfies its purpose as defined by the customer needs. The map purpose is a driving factor for the scale of the map and, thus, the level of generalization of the available source data, which is the fundamental task in map making. It becomes apparent that good cartography, besides good data, requires communication between map maker and reader, their exchange of views, needs, practices, and the evaluation of any new functionalities in their efficiency to convey the message as intended by the cartographer and requested by the customer.
Recognizing the importance of the above in nautical cartography, Christos Kastrisios and Andy Armstrong are leading the Center’s effort to establish collaborations with the US Maritime Training Centers. Within the context of the collaborations, we seek to gain better understanding of the current practice in maritime education and within the profession, and to give mariners an insight into cartographic practice for the compilation of charts and publications, and the international standards that govern those products. Collaborations will provide opportunities for both sides to discuss, exchange views, and evaluate ideas in topics such as the problems the maritime community encounters from the use of existing nautical charts, publications, and systems (e.g., ECDIS, AIS); the integration and visualization of additional layers of maritime information (Marine Information Overlays, e-navigation); the interpretation of nautical charts by the mariner (e.g., the method by which the mariner interpolates depths from the portrayed bathymetry as previously discussed); and the future of electronic charts. The results of these discussions and investigations will be applied in our research for the improvement of developing projects so that they better address the mariners’ needs.
In previous reporting periods the team contacted and met with faculty members and the executive director of MITAGS in Baltimore, MD, which became the first maritime training center that the Center agreed to collaborate with on the above items. In the current reporting period, the team contacted the SUNY Maritime College, the Massachusetts Maritime Academy, and the US Merchant Marine Academy, and has thus far discussed and agreed with faculty members from the last to continue and enhance the discussions.
Project: Extracting Chart-related Maritime Accident Causes from Accidents Reports Using Machine Learning
Maritime accident reports contain a wealth of information that can serve as lessons learned to identify chart related issues that can be improved with the aim to alleviate the risk for similar accidents in the future. For example, maritime accident reports demonstrate that data quality (as encoded with the Zones of Confidence) are poorly visualized and perceived by mariners and thus rarely used, e.g., the case of the cargo vessel Nova Cura. In a similar vein, cartographic practices often necessitate the use of a point symbol to chart an isolated danger for the compilation scale. However, the ability of users to change the viewing scale in ECDIS may pose a risk since point symbols scale with scale changes (see, e.g., the case of the LPG tanker Pazifik)
The aim of this project is to identify nautical cartography-related issues that have led to maritime accidents and the ways that nautical charting could be improved to decrease the associated risks for marine navigation. In the current reporting period, Christos Kastrisios and Kim Lowell investigated methods to automate the study of accident reports and the extraction of the required information from them. The team applied two types of automated text analysis, semantic similarity analysis (SSA) and Latent Dirichlet Allocation (LDA), to accident reports published by the Japan Transport Safety Board (in English).
SSA identifies the user-specified n words that are semantically most similar to a target word such as “chart” (Figure 37-11a). Semantic similarity is usually determined by proximity of words to the target word within a sentence or paragraph. This information may assist subjective human analysis of accident reports, though the meaning of these words relative to accidents and maritime cartography must then be discerned.
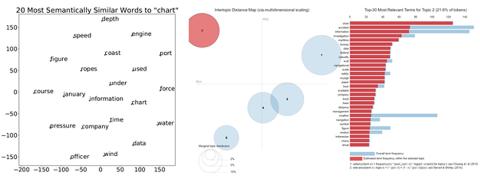
Figure 37-11. Results of text analysis of seven Japanese ship grounding reports. a. (Left) Semantic similarity analysis. b. (Right) Topic modelling.
LDA identifies a user-specified number of “topics” and then assigns each word to one of the topics based on their semantic similarity determined by mutual presence across sentences, paragraphs, sections, or whole documents. LDA is conceptually comparable to numerical clustering techniques such as k-means. In Figure 37.11b, Topic 2 in orange clearly relates to cartography – “chart” is the most important word in Topic 2 and all 125 occurrences of “chart” in the test dataset have been assigned to Topic 2. Topic 2 is also semantically isolated – i.e., distinct from the circles for the other four topics – suggesting that “charts” are not relevant to the other topics identified. LDA potentially provides information about the role of cartography in ship groundings but, based on the preliminary result, it is clear that, as with SSA, human interpretation (and method refinement) is required.
For future work, the team considers it would be beneficial to rigorously study a larger number of grounding accident reports, refine the words analyzed, remove sections of the accident reports from the textual analysis, and examine results from multiple countries and languages.