JHC/CCOM Participants: Christos Kastrisios and Brian Calder
Other Collaborator: Megan Bartlett (NOAA MCD)
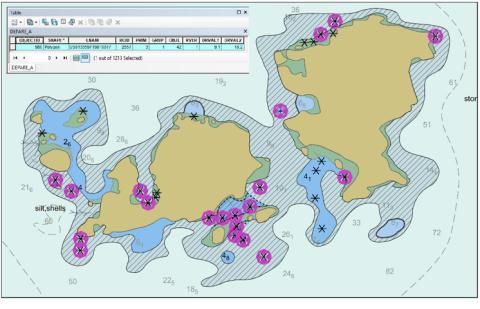
Figure 37-8. Depth area (populated depth range 9.1m – 18.2m) vertically inconsistent with the adjacent land and depth areas.
Spatial objects in ENCs are divided into two groups, namely Group 1 (known as the “skin of the earth”) and Group 2 features. Group 1 features are area-type geo-objects such as DEPARE (depth area), LNDARE (land area), DRGARE (dredged area), UNSARE (unsurveyed area), FLODOC (floating dock), HULKES (hulk), and PONTON (pontoon). For Group 1 features, each area covered by a meta-object M_COVR (coverage) with CATCOV = 1 (i.e., that continuous coverage of spatial objects is available within this area) must be totally covered by a set of the above geo-objects that must not overlap. As the nautical chart is a projection of 3D topology onto a 2D surface, the IHO has developed a number of validation checks for ENCs (defined in IHO S-58) to ensure that their topological structure is valid. Many of the checks deal with the vertical component of the nautical chart, ensuring depth continuity is consistent among geo-objects of Group 1, as well as those between Group 1 and Group 2 geo-objects.
However, validation checks for vertical continuity are not exhaustive, and spatial relationships may be violated among adjacent objects. For instance, Figure 37-8 illustrates a depth area which has been encoded with depth range 9.1–18.2 m (shaded area). However, it is apparent that the populated depth range is incorrect for many parts of the specific depth area (e.g., where the outline of the depth area touches that of land features).
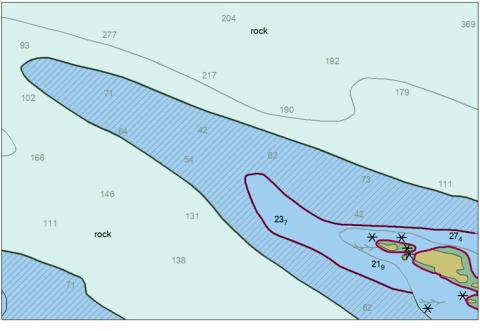
Figure 37-9. Depth area 18.2m – 36.5m that appears shoaler than the actual depth in the area.
Such discontinuities in ENCs may affect research in nautical cartography (e.g., it complicates the surface reconstruction from the charted bathymetric information as for the previous project), undermines the reliability/quality of the product, and, most importantly, may pose a threat to navigation. For instance, for a vessel with safety contour set to 9.1m, ECDIS will treat the water within the entire extent of the shaded depth area in Figure 37-8 as navigable and will not trigger any alarms, although the water depth is less than 9.1m in many parts of the depth area.
In a different situation of vertical inconsistency, and contrary to that illustrated in Figure 37-8, depth areas may appear shoaler than actually are. Consider Figure 37-9, where the shaded depth area is populated with minimum depth value of 18.2m (depth range 18.2m – 91.4m) and adjoins a depth area with depth range 18.2m – 36.5m. The coincident depth curve has populated depth value of 36.5m, thus the depth area in question should be split and, where appropriate, be assigned a depth range of 36.5m – 91.4m. Cases like this may make navigable waters appear as non-navigable in ECDIS and trigger useless ECDIS alarms, contributing to the unpleasant situation known as “mariner’s deafness.”
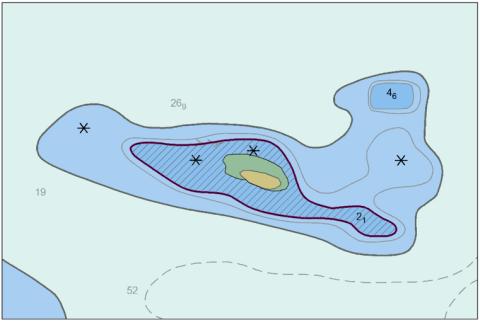
Figure 37-10. Depth area encoded in different units than the adjoining depth area and the delimited depth curve (i.e., fathoms vs meters).
Furthermore, other cases of vertical discontinuity on ENCs are where depth areas have been encoded in units different than the adjoining depth areas, e.g., fathoms instead of meters. For instance, the shaded area in Figure 37-10 has populated depth of “3” (apparently in fathoms) contrary to the proper 5.4 (in meters) whereas the adjoining depth area and their coincident geometry (depth curve) have been properly encoded in meters.
In the previous reporting period, Christos Kastrisios and Brian Calder, in collaboration with Megan Bartlett (NOAA MCD), worked on developing an algorithm for the automated identification of the vertical discontinuities between depth areas and adjacent geo-objects on charts. The research work aims to improve depth continuity among geo-objects in ENCs but recognizes that the complete elimination of inconsistencies may be incompatible with the legibility constraint and cartographic design principles. Therefore, the research currently focuses on introducing a semi-automated process, where the algorithm determines the parts of the depth areas that require the user’s attention, with the cartographer being responsible for remediation.
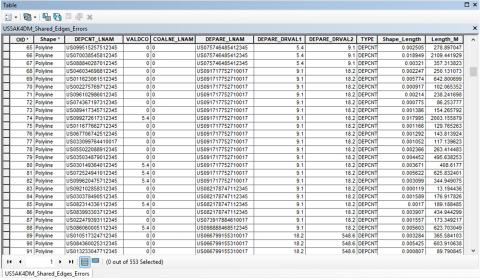
Figure 37-11. The output table for US5AK4DM for which the application identified 53 depth areas and 553 coincident edges with errors in depth continuity.
In the current reporting period, the research focused on identifying the geographical situations (and improving the implementation accordingly) where vertical discontinuities are expected (e.g., in the crisp boundaries of shoreline constructions or dredged areas and the adjoining depth areas) so that it captures only the discontinuities of the sea-bottom surface that should not, in principle, occur (e.g., the fuzzy boundaries of two depth areas or a depth area and shorelines).
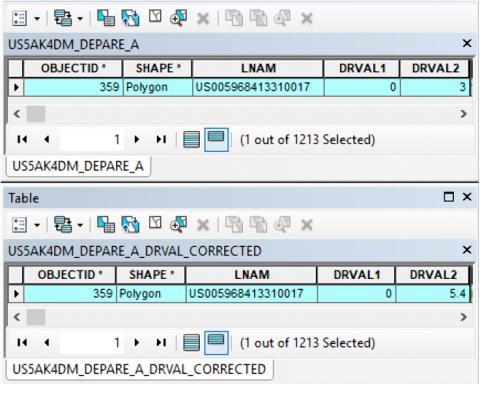
Figure 37-12. The attributes table of the depth area in Figure 37-10 before and after the attribute fixes.
Furthermore, the team focused on investigating solutions for the identified errors and providing them as suggestions to the cartographer. The initial approach is recursive and begins with finding corrections for the attribute values. That includes, in the first iteration, the depth areas that adjoin land areas (e.g., the example in Figure 37-8) and, in the second iteration, the depth areas encoded in incorrect units (e.g., the example in Figure 37-10). Figure 37-11 presents the initial situation for the US5AK4DM ENC where the application identified 53 depth areas and 553 coincident geometries (edges) with errors, which, after applying the attribute fixes of the first two steps, are reduced to 41 and 365 respectively (i.e., a reduction of 23% and 33% respectively). Figure 37-12 shows that the populated DRVAL2 depth value of 3 fathoms discussed previously has been corrected to 5.4 meters.
Once the two steps for fixing the attribute errors are complete, the tool iterates between suggesting fixes and altering the geometry of the depth areas. That includes splitting the respective areas and assigning the proper depth range to each new depth area. This functionality is still under development and will continue during the next reporting period. The error fixing process currently results in suggestions for implementation by cartographers. The necessity and feasibility of a fully automated solution, where the determination of inconsistencies and their correction is performed automatically, will be considered in the future.