JHC/CCOM Participants: Christos Kastrisios and Brian Calder
A common criticism of automatically generated contours is that they are “noisy” or “rough,” and that they therefore do not adequately represent what an experienced cartographer would generate from the same source data. While some use is made of automatic contours in modern chart production, they are often edited manually, which requirement immediately precludes any fully automated solution, since every manual adjustment of a contour node has to be individually recorded.
A successful contour generation (and generalization) algorithm must therefore contain some contextual knowledge as to the types of contours that cartographers draw at different scales in order to generate appropriate products. For example, automated solutions for depth contour generalization typically require the user to define a maximum length of line segments. During the generalization process, consecutive short line segments are replaced by longer lines which may not exceed the chosen maximum length. A large length may improve the simplification process but results in segments so long as to be aesthetically unacceptable; very small lengths might result to very detailed and complex contours, possibly very similar to the raw ones.
Assuming that current products are adequate in this sense, it seems reasonable that a statistical analysis of the contours could be used to characterize what makes contours “acceptable.”
Analysis of production ENCs from the U.S. suite was conducted to determine the distribution of the mean contour segment length (at chart scale) for each contour in the ENC, and then aggregate for all contours at a given depth (i.e., the VALDCO in the S-57 encoding), Figure 37.3. Statistical moments of the data distribution (e.g., mean, standard deviation, skewness and kurtosis) are then computed and examined for fit to standard statistical distributions. Although the goal is to determine the optimum length of line segments for use in automated software solutions, the algorithm may also identify potential patterns and anomalies of data, e.g., patterns for contours with very small or very large mean length of line segments, which could be used to flag contours requiring investigation or further processing during chart compilation.
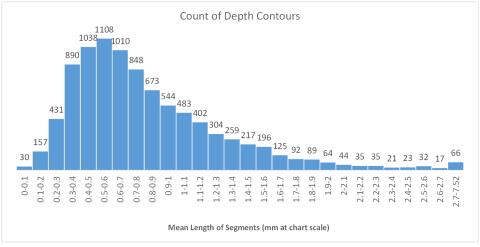
Figure 37-3. The histogram of the mean length of segments for contours with VALDCO 18.2m in ENC US5AK4DM. Data follow the exponentially modified Gaussian distribution with mean 0.82mm, standard deviation 0.51mm, kurtosis 10.52 and skewness 2.146.